Gross rental yield in Dubai ranges from 1.5% to 7.7% depending on the district. Here's how to calculate it, where it's highest and which pitfalls eat into it.
On this page
- Rental yield in Dubai: what to really expect?
- How do you actually calculate the yield on an apartment (worked example)?
- Where are the best gross yields, district by district?
- High yield or capital gains: what do the figures reveal over 5 years?
- Off-plan or completed property: what impact on real yield?
- The pitfalls that eat into the headline yield
Rental yield in Dubai sits at around 5 to 8% gross depending on the district, with a market median of 5.6% calculated across 65 districts that have both a sales and a rental series (Bayut data, March 2026). That single figure hides a considerable gap: it has to be read district by district, never as an average rate that holds everywhere.
In concrete terms, it runs from 1.5% at La Mer to 7.7% at Dubai International City according to the same Bayut data. The district, the price per square foot and the property type shape the outcome far more than the overall market. Here we break down the calculation method, the most profitable areas and the costs that separate a headline yield from a yield you actually pocket.
Rental yield in Dubai: what to really expect?
Gross rental yield in Dubai comes in at around 5 to 8% depending on the district, with a market median of 5.6% across 65 districts that have both a sales and a rental series (Bayut data, March 2026). It's a range, not a single rate.
The real spread is striking, as the district-by-district breakdown further down shows. The outcome depends first on the district, then on the price paid per square foot, and very little on the market "average." An investor who thinks in overall rates is using the wrong compass.
One advantage changes the picture in Dubai: private individuals pay no tax on rental income (0%, official UAE government portal). Gross and net-after-tax therefore stay close, which isn't the case in most European markets.
The through-line fits in a single sentence: affordable districts such as JVC, Arjan or International City deliver 7 to 10%, while premium districts like Downtown or Marina hover around 5 to 6% (Bayut, Dubai Sales Market Report).
Investors weighing Dubai's yields against other lifestyle-driven destinations often ask how the Emirate stacks up abroad: our comparison of investing in Dubai versus Bali examines how legal security, freehold ownership and the 0% tax on rental income tip the scales, set against the far lower entry ticket of Bali.
How do you actually calculate the yield on an apartment (worked example)?
Gross yield is calculated by dividing annual rent by the purchase price, both per square foot so districts can be compared with one another. Take a real case in Arjan: AED 1,485/sq ft on sale, rent of AED 106/sq ft/year, giving a calculated gross yield of 7.1% (Bayut data, March 2026).
Same method in the premium segment, opposite result. In Downtown Dubai, the price reaches AED 3,454/sq ft for rent of AED 194/sq ft/year, a gross yield of 5.6% (Bayut data, March 2026). The premium rent doesn't make up for the far higher entry price.
From gross to net: what to subtract
The first item is annual service charges, ranging from 3 to 30 AED/sq ft/year and regulated through RERA's Mollak platform. Reckon on ~10-20 for a standard apartment, 20-50+ for a luxury tower, and only ~2-6 for a villa (RERA / DLD Service Charge Index).
The first year weighs in too: the Dubai Land Department transfer fee of 4% of the price, roughly AED 4,700 to 5,500 in fixed fees on top, and on the secondary market an agency fee of 2% + 5% VAT (paid by the buyer). These costs cut into the yield in the year of acquisition.
Where are the best gross yields, district by district?
The highest gross yields are found in affordable districts: Dubai International City at 7.7% (AED 1,000/sq ft), Wasl Gate at 7.7%, Damac Lagoons and Dubai Production City at 7.5% each, according to Bayut data (March 2026). For the full ranking of the best areas in Dubai for rental yield, from affordable tickets to liquid premium, see our dedicated guide.
A project in mind?
Talk to a Lucretia adviser
Tailored guidance, no obligation.
The mid-range offers a good balance between entry price and rent: Arjan 7.1%, Jumeirah Village Circle 7.2%, Al Furjan 6.9%, Dubai Sports City 6.8% and Dubai Science Park 6.6% (Bayut data, March 2026).
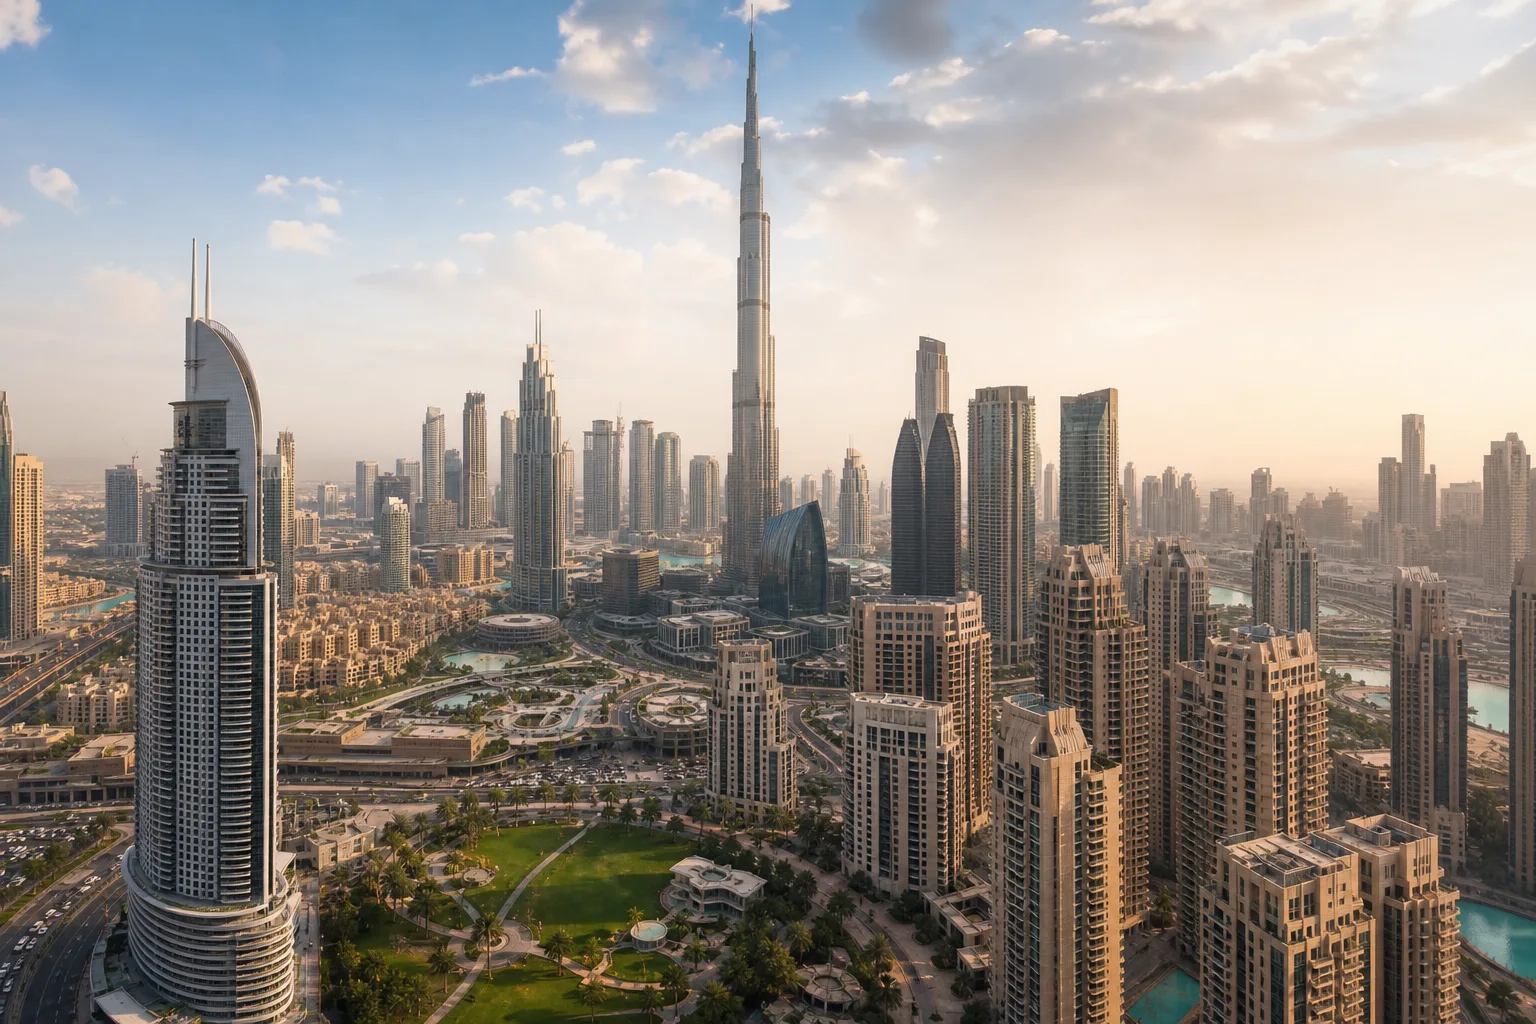
Premium districts yield less, but hold their role as a safe haven. Palm Jumeirah caps out at 4.5% (AED 4,336/sq ft), Business Bay at 5.8% and Downtown Dubai at 5.6% (Bayut data, March 2026).
At the other extreme, prestigious areas post floor-level yields: La Mer 1.5%, Trade Center 1 1.7%, Bukadra 3% (AED 2,215/sq ft for rent of just AED 67/sq ft/year). A high price never mechanically means a good yield.
To weigh up these areas against your objective, our complete guide to investing in Dubai details how to choose a district. You can also browse all the listed districts.
High yield or capital gains: what do the figures reveal over 5 years?
A high yield and strong appreciation don't always go together: some districts pay little in rent but appreciate fast, and the reverse is true too. Yield alone isn't enough to judge an investment.

Look at Jumeirah Garden City: +147.6% over 60 months, but a gross yield of just 4.8% (Bayut data, March 2026). Same logic at Dubai Industrial City: +132.1% over five years for a 5.3% yield. These areas play on capital appreciation, not on rent.
Other districts combine both engines. Dubai Silicon Oasis posts a 6.3% yield and +108.9% over 60 months; Dubailand Residence Complex 6.3% and +110.9% over the same period (Bayut data, March 2026). These are the most balanced profiles.
The overall strategy — yield, capital gains, property type — is covered in our complete guide. To put these five-year figures in context, our overview of Dubai's real estate market trends reads the wider picture figure by figure, from the normalised pace of growth to the median price per square foot.
Off-plan or completed property: what impact on real yield?
A completed property generates rent from the moment the keys are handed over; an off-plan purchase produces no yield until it's delivered, staggered from 2026 to 2031 depending on the projects in the catalogue. The timeline for collecting rent is therefore the first difference between the two options.

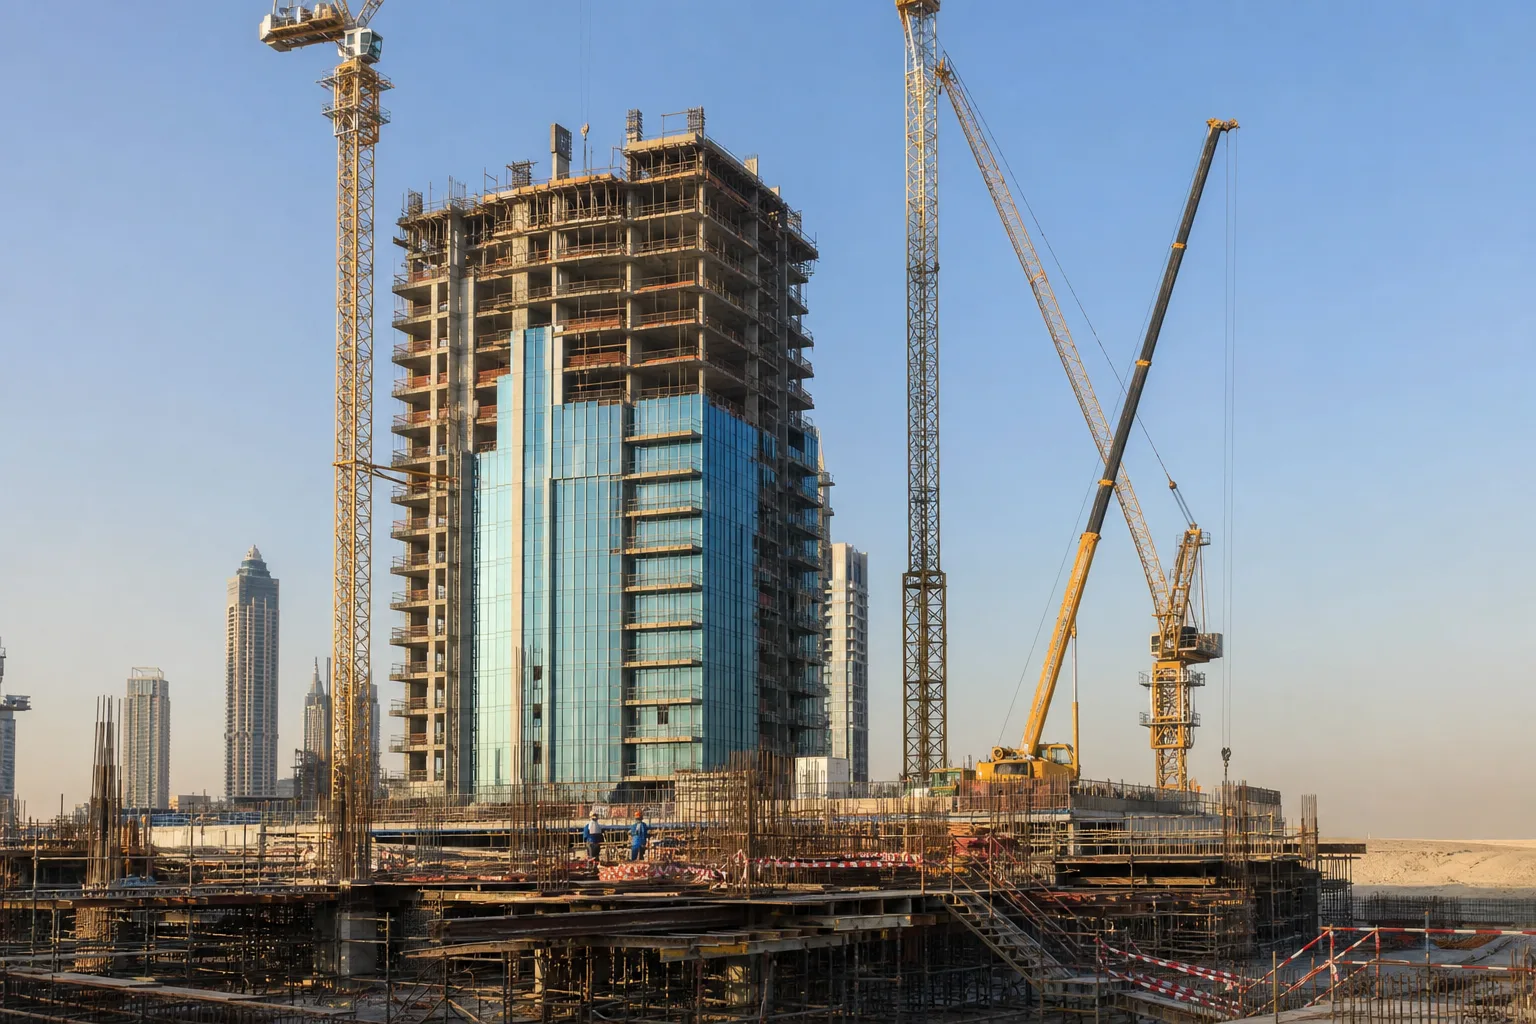
Off-plan has one advantage: the upfront outlay is low. The deposit ranges from 5 to 20% of the price, often 10 to 20%, and the funds are secured in an escrow account, mandatory since Law No. 8 of 2007 (RERA/DLD oversight). The remainder is paid in instalments up to delivery.
Among the affordable projects we list, Coventry Curve 2 starts at AED 500,000 in Dubai Industrial City, and AUM 99 Residences at AED 600,000 in Dubailand Residence Complex. This low entry ticket mechanically supports the yield once the property is let.
The effect of financing
Leverage amplifies the return on equity. A non-resident can in practice obtain 50 to 75% LTV depending on the bank, and off-plan is capped at 50% (CBUAE). Less equity tied up, better return on the amount actually invested — provided you can cover the instalments. Our guide on financing a Dubai purchase as a non-resident details the down payment to plan for and the fees to cover in cash.
The full walkthrough of an off-plan purchase is explained in our guide to investing in Dubai.
The pitfalls that eat into the headline yield
The first pitfall is rental vacancy. A gross yield assumes the property is let continuously, whereas a few weeks without a tenant is enough to melt away the real outcome: a headline 7% can turn into a 6% pocketed.
Featured
View projects: Dubai Harbour Residences
From AED 7,168,667
Hand-picked new properties with end-to-end expert support.
View projects
The second is underestimating charges. A luxury tower bills up to 50+ AED/sq ft/year in service charges (RERA / DLD Service Charge Index): this item can wipe out the yield gap with an affordable district that carries far lower charges.
The third is the mirage of the high price. A premium price per square foot crushes the yield: Ras Al Khor Industrial 1 drops to 2.8% and Trade Center 2 to 1.9% (Bayut data). Always cross-check price against rent before signing.
The fourth is acquisition costs left out of the first-year calculation, detailed above: DLD transfer, fixed fees, agency fees and VAT on the secondary market. They weigh on the yield in the year of purchase.
With my clients, the most common mistake is comparing two properties on their headline gross yield without ever opening up the charges line. On an upmarket tower, that's often where the real difference plays out.
— Zakaria SEBAIBI, Real Estate Consultant
For each property we calculate a realistic net yield, by district and by property type, once the recurring costs are laid bare. Our dedicated guide on managing a Dubai rental and its service charges walks through the Ejari lease, the Mollak-regulated charges and the move from gross to real yield. The other pitfalls are gathered in our complete guide.
In this guide
Articles in this guide
This article is part of our guide
Dubai Property Investment Guide for Foreign Buyers
About the author

Zakaria SEBAIBI
Real Estate Consultant
Originally from Asnières-sur-Seine and holding a Master's degree in finance, Zakaria specializes in the sale of off-plan real estate properties. With a long-term vision and a spirit of shared trust, he stands out for his excellent listening skills and his ability to understand his clients' needs. Resilient and determined, he puts his expertise at the service of those wishing to invest in the off-plan market, ensuring personalized support.