Normalised growth, yields from 1.5% to 7.7% by district, a median price of 1,883 AED/sq ft: Dubai's real estate market trends, read figure by figure.
On this page
- Dubai real estate market: which trends matter?
- Fast growth, slow growth: two speeds behind the average
- Where prices stand today: the map of price-per-square-foot tickets
- The yield trend: where rental cash stays highest
- What shapes the trends: regulation, visa and new supply
- Reading a trend without getting it wrong: the interpretation traps
Today, Dubai real estate market trends point to moderate, normalised growth. The median change stands at +2.6% over 12 months, for a median price of 1,883 AED/sq ft (Bayut, most recent reading August 2026). The surge of the past five years has given way to slower progress that remains firmly positive, driven by solid international demand.
Behind that average lies a vast and contrasted landscape: more than 70 tracked districts, price-per-square-foot tickets ranging from single to sixfold and widely dispersed gross yields. The trend is never read as a single block — it is deciphered district by district.
Dubai real estate market: which trends matter?
The market is showing slower but positive growth: the median rise reaches +2.6% over 12 months, for a median price of 1,883 AED/sq ft according to Bayut data (August 2026). We are far from the double-digit surges of the post-2020 period — the momentum has normalised.
On the rental side, the gross yield holds between 5% and 8% depending on the district (Bayut, 2025), with a market median of 5.6% across districts that have both a sales and a rental series. That level remains high compared with most major metropolises.
The heart of the matter is a gap: the gross yield runs from 1.5% at La Mer to 7.7% at Dubai International City, and valuation from one district to another bears no comparison. Talking about a "market average" only makes sense as a benchmark. To choose between two areas depending on your objective, our guide on where to invest in Dubai lays out the decision grid district by district.
Fast growth, slow growth: two speeds behind the average
Behind the +2.6% median lie two opposing paces. Over 12 months, Bukadra jumps +12.2%, Dubai Silicon Oasis +5.7% and Dubai Industrial City +5.6%, while mature areas such as Business Bay settle for +0.9% and Downtown Dubai for +1.7% (Bayut data, February/March 2026).
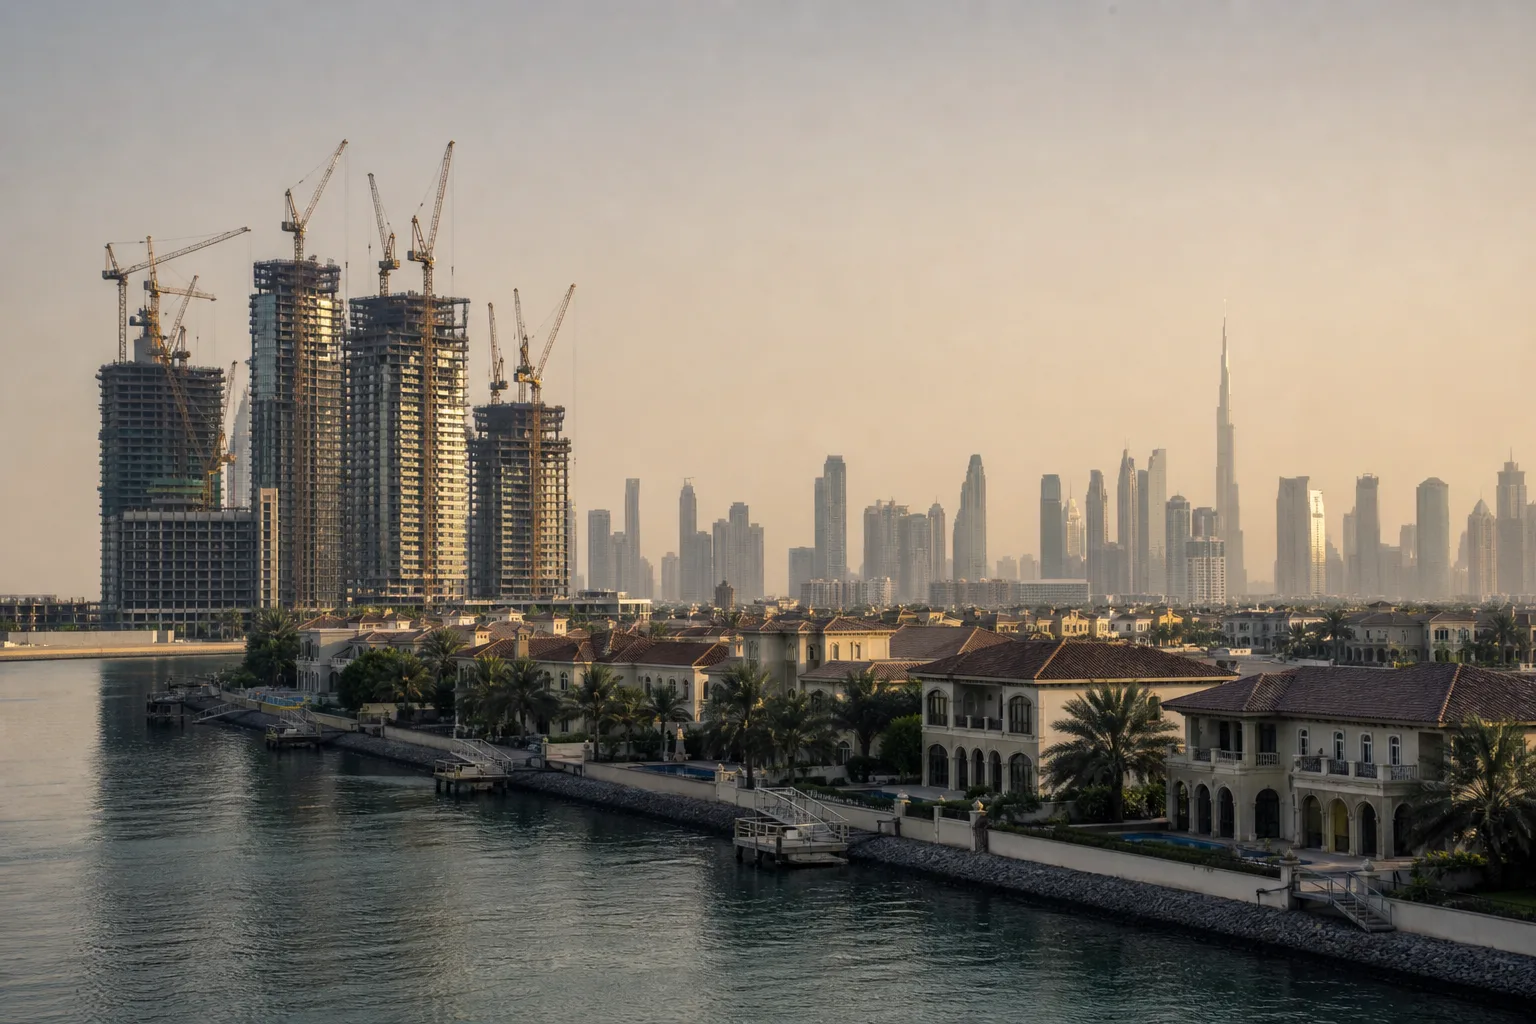
The five-year reading is even more telling. Affordable areas have caught up dramatically, while premium districts have progressed more soberly. The table below sets the two speeds side by side.
| District | Price (AED/sq ft) | 12 months | 60 months |
|---|---|---|---|
| Jumeirah Garden City | 2,097 | +2.2% | +147.6% |
| Dubai Industrial City | 1,331 | +5.6% | +132.1% |
| Dubailand Residence Complex | 1,277 | +3.4% | +110.9% |
| Dubai Silicon Oasis | 1,370 | +5.7% | +108.9% |
| Palm Jumeirah | 4,336 | +1.7% | +69.1% |
| Business Bay | 2,445 | +0.9% | +64.9% |
| Downtown Dubai | 3,454 | +1.7% | +51.9% |
Bayut data (February/March 2026). Affordable areas led the catch-up over five years; premium districts appreciated more moderately, but durably.
Where prices stand today: the map of price-per-square-foot tickets
Prices per square foot spread from 1,000 to more than 4,300 AED depending on the area (Bayut, March 2026). At the low end: Dubai International City at 1,000 AED/sq ft, Dubai Sports City at 1,318 and Dubai Industrial City at 1,331. At the high end: Palm Jumeirah at 4,336, Downtown Dubai at 3,454 and Dubai Maritime City at 2,785 AED/sq ft.
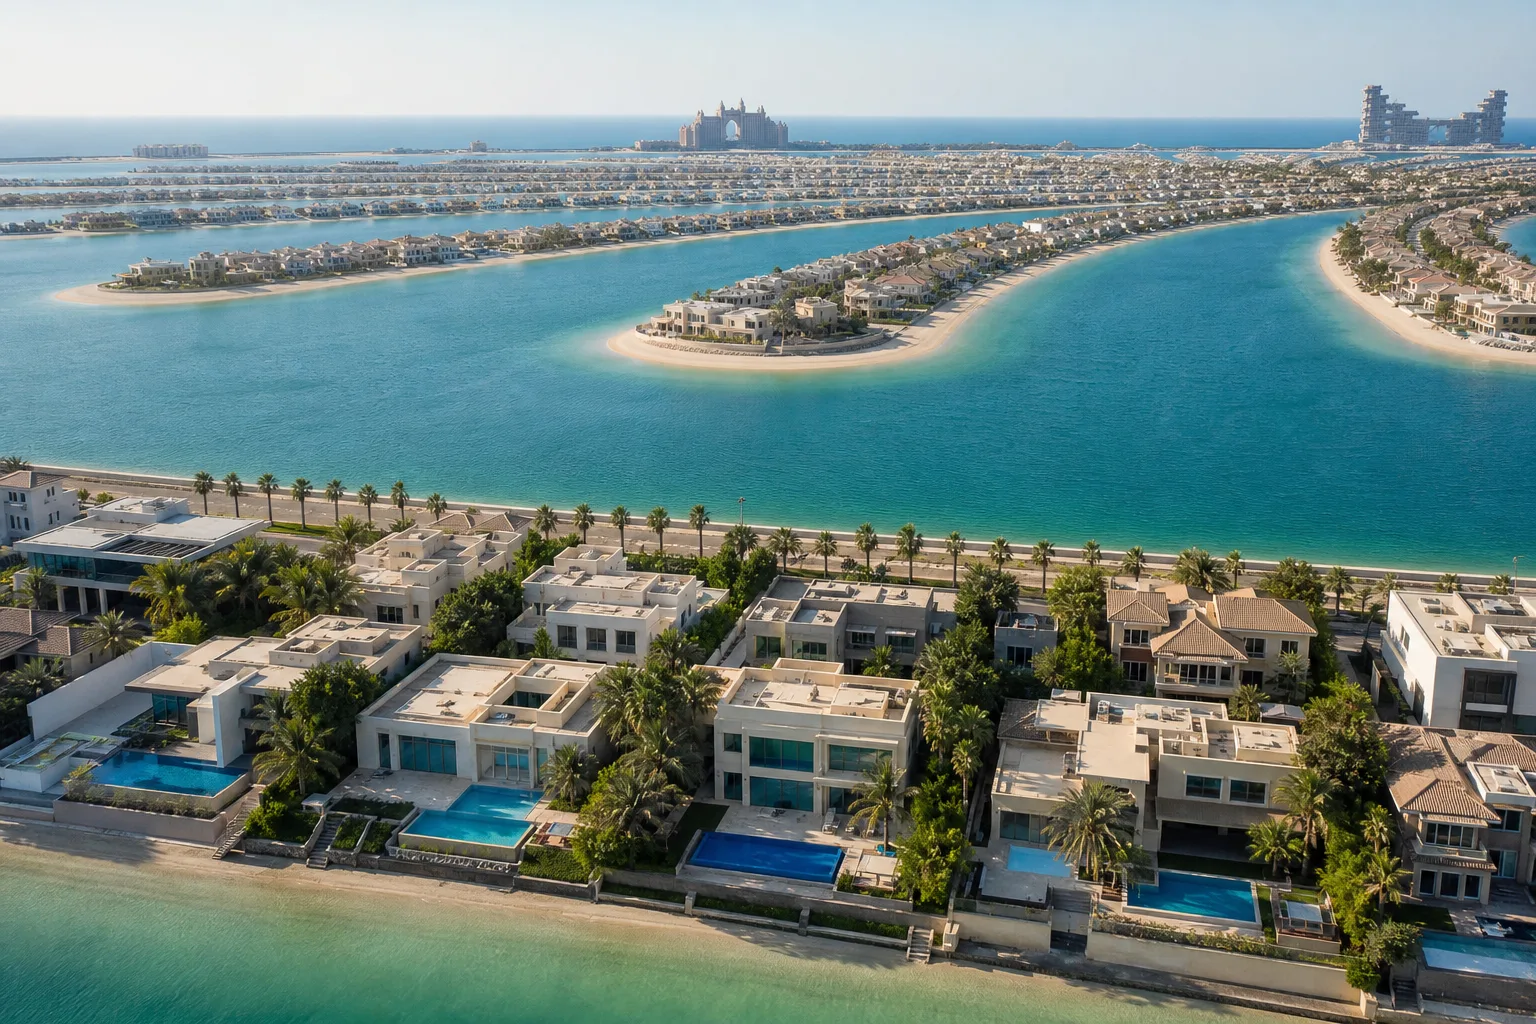
Between the two, a mid-range structures the offering: Business Bay at 2,445, Dubai Islands at 2,379 and Jumeirah Garden City at 2,097 AED/sq ft (Bayut). The market median price, 1,883 AED/sq ft, serves as a dividing line: above it, you enter the upper tier; below, the accessible one.
The waterfront hubs to watch
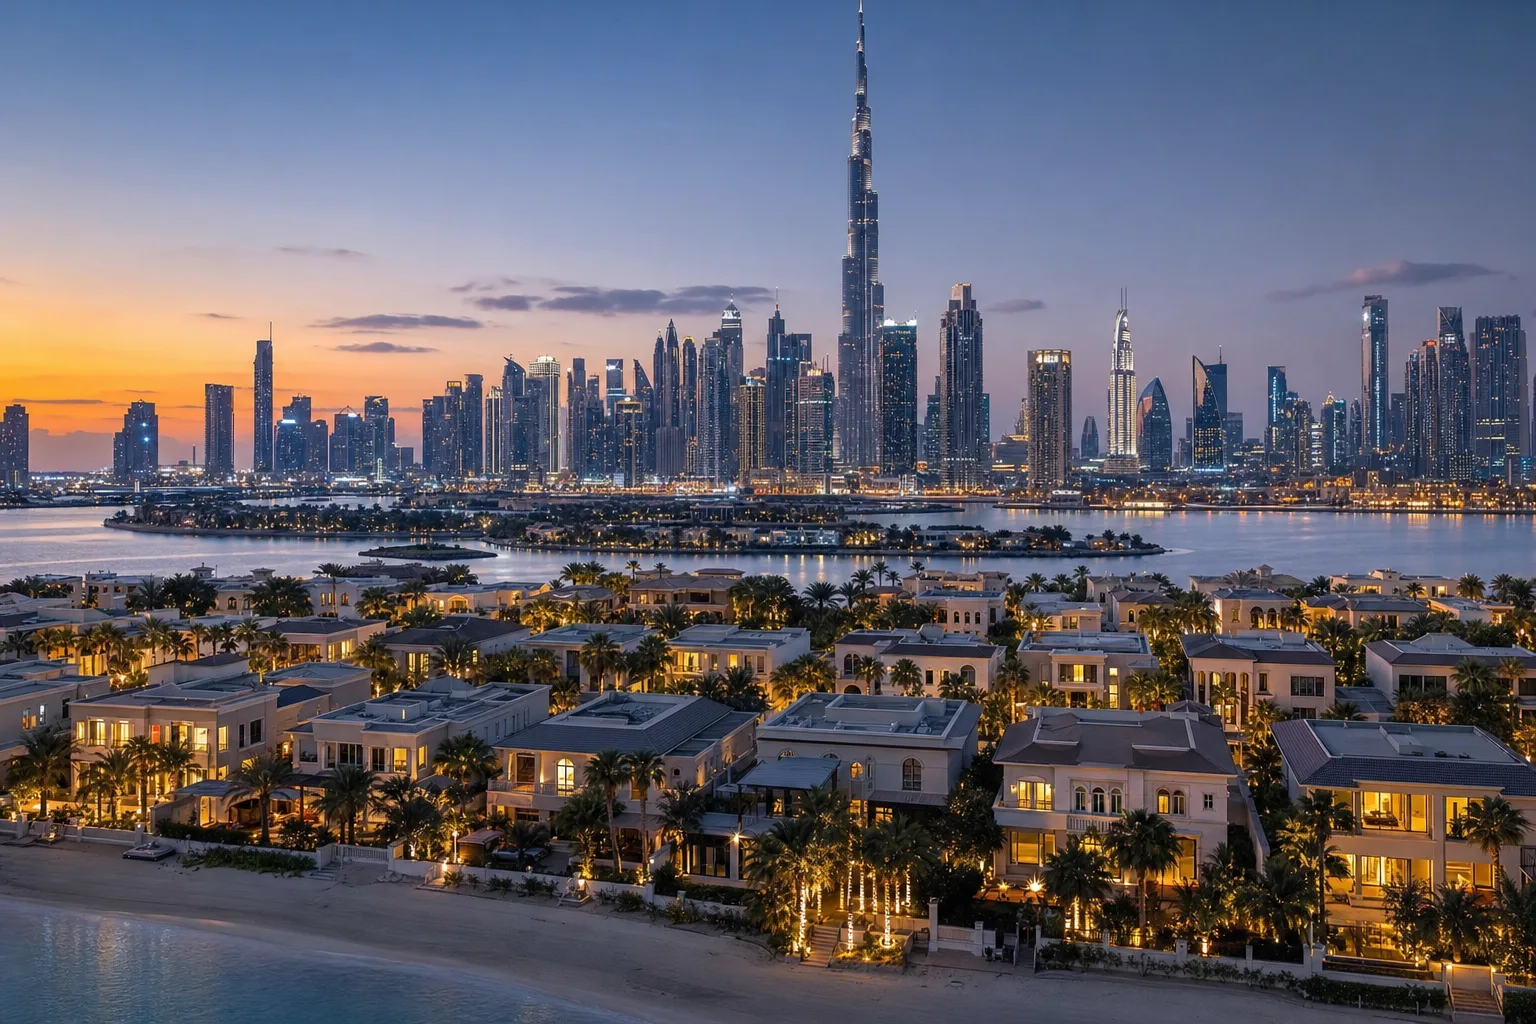
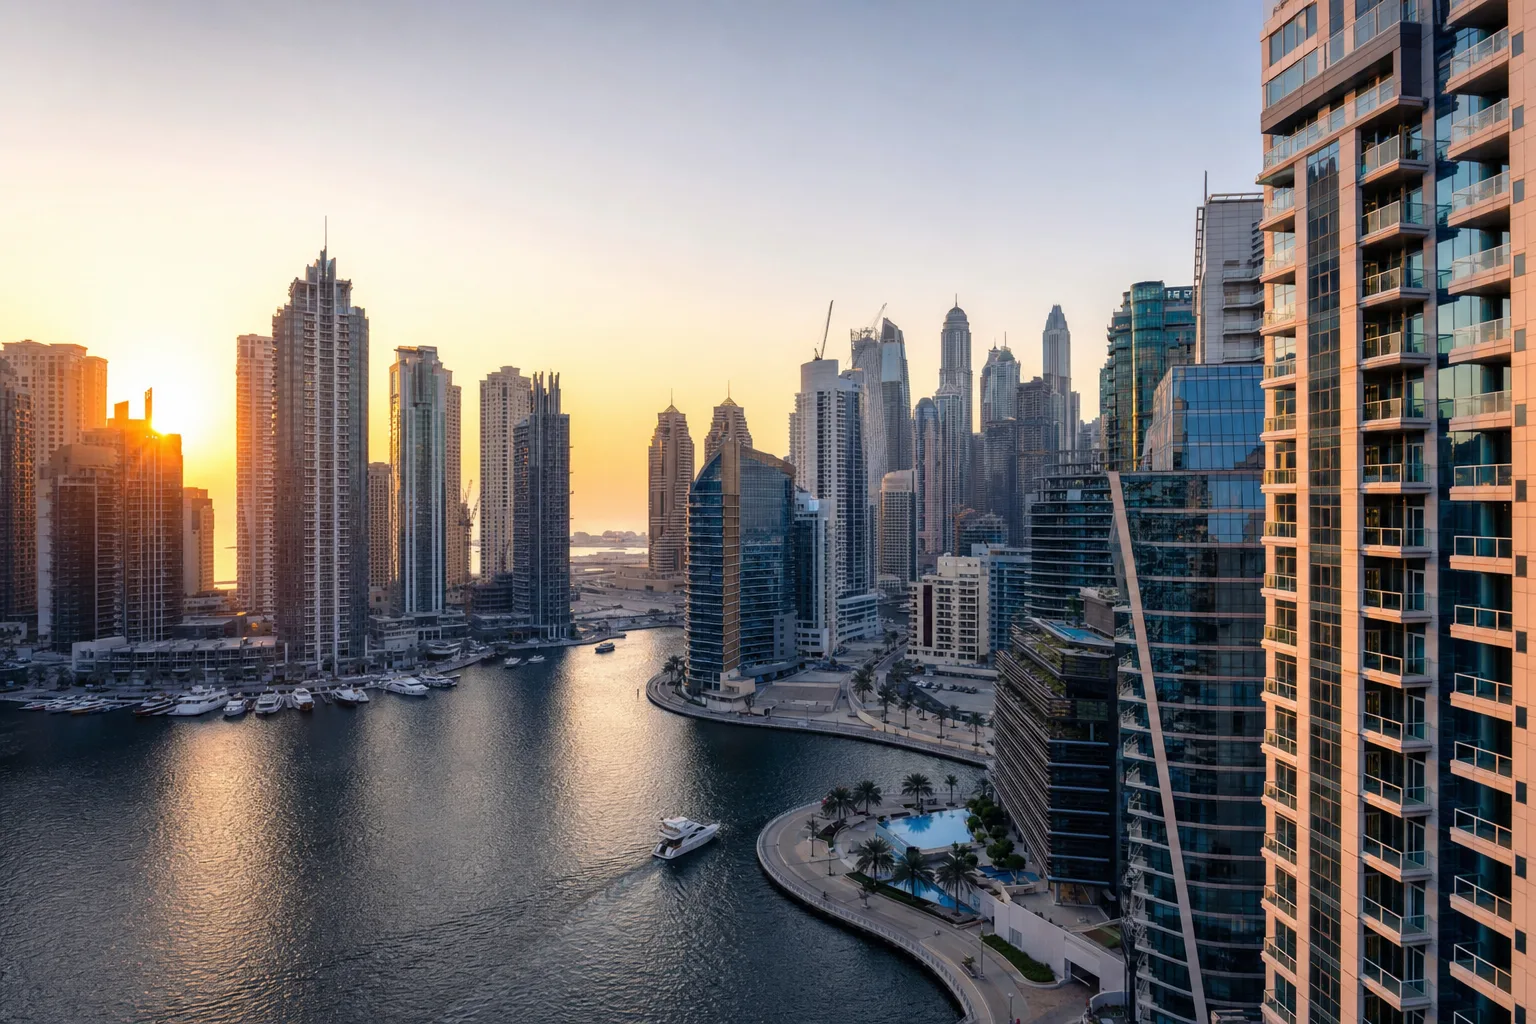
Two emerging areas are drawing attention: Dubai Islands at 2,379 AED/sq ft (+4.1% over 12 months) and Dubai Maritime City at 2,785 AED/sq ft (+4.4%). These recent waterfronts are rising above the market median, a sign of sustained appetite for new-build by the water (Bayut, March 2026).
The yield trend: where rental cash stays highest
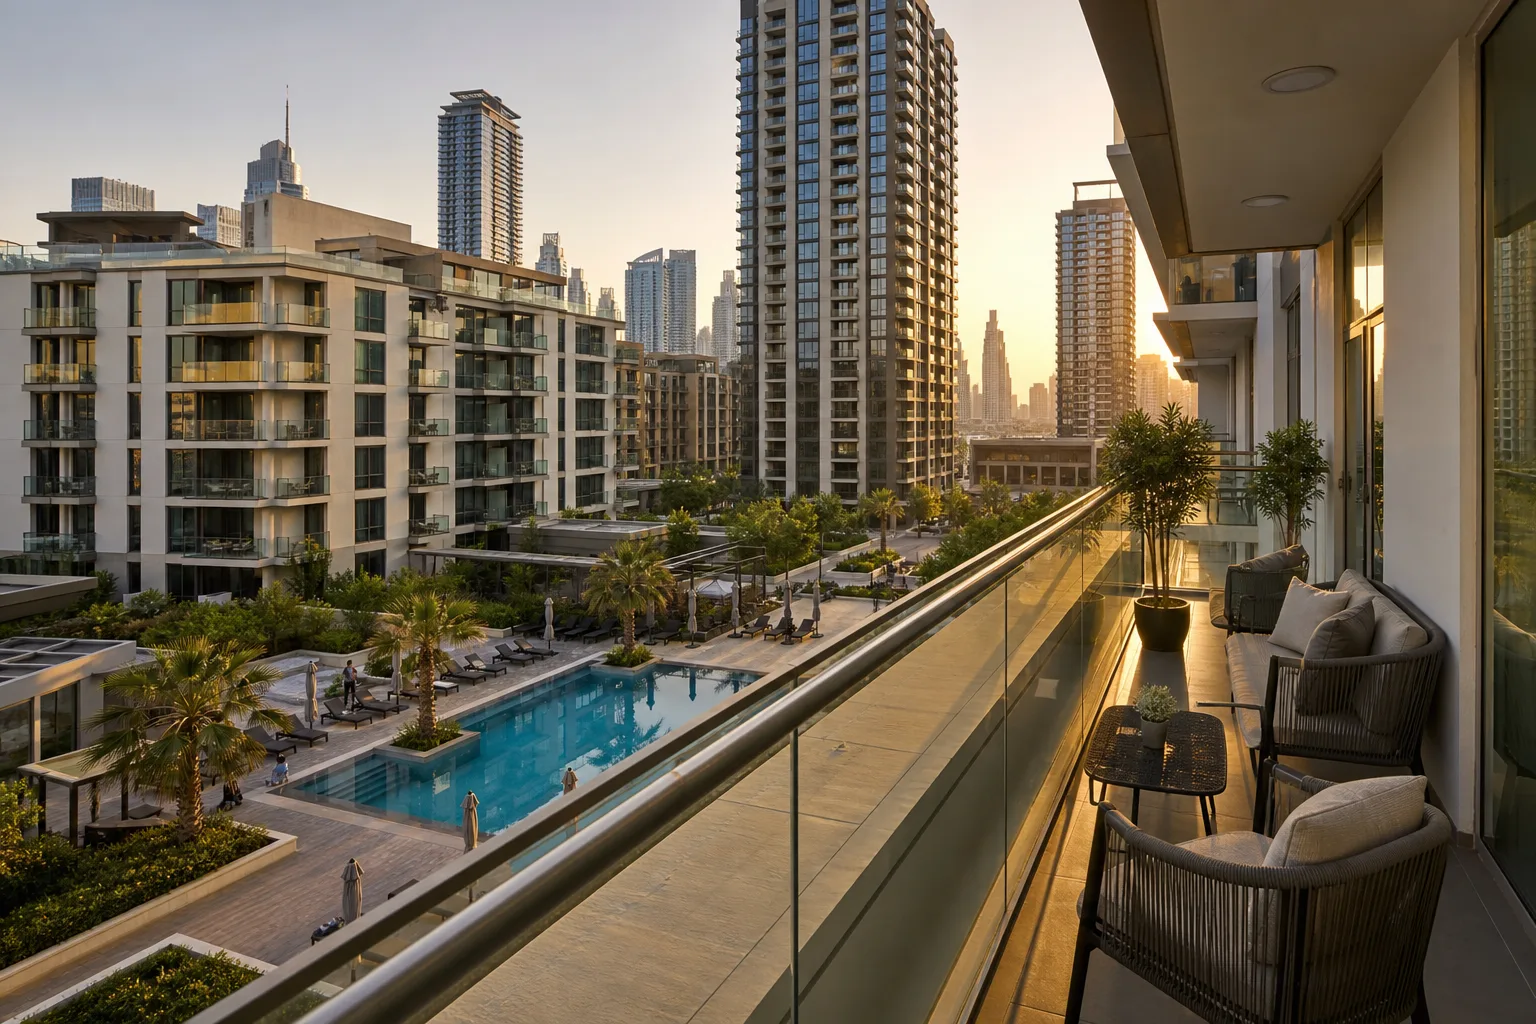
Gross yield peaks in affordable districts: Arjan at 7.1%, Dubai Sports City at 6.8% and Dubai Science Park at 6.6%, against 4.5% at Palm Jumeirah and 4.8% at Dubai Maritime City (calculated gross yield, excluding charges and vacancy, Bayut). Rent per square foot set against price explains it all.
A project in mind?
Talk to a Lucretia adviser
Tailored guidance, no obligation.
The mechanism is mechanical: at Arjan, 106 AED of annual rent for 1,485 AED/sq ft at purchase gives 7.1%; at Downtown Dubai, 194 AED of rent for 3,454 AED/sq ft falls to 5.6%. The higher the price climbs, the more the yield compresses — prestige is paid for in profitability points.
To turn those percentages into real cash flow, with charges and vacancy, our guide on rental yield in Dubai works through the full calculation.
What shapes the trends: regulation, visa and new supply
Three structural drivers underpin demand. Freehold ownership has been open to foreigners in designated zones since 2002, and the 10-year Golden Visa is granted from 2M AED invested (Dubai Land Department). That foundation attracts a continuous flow of international buyers.
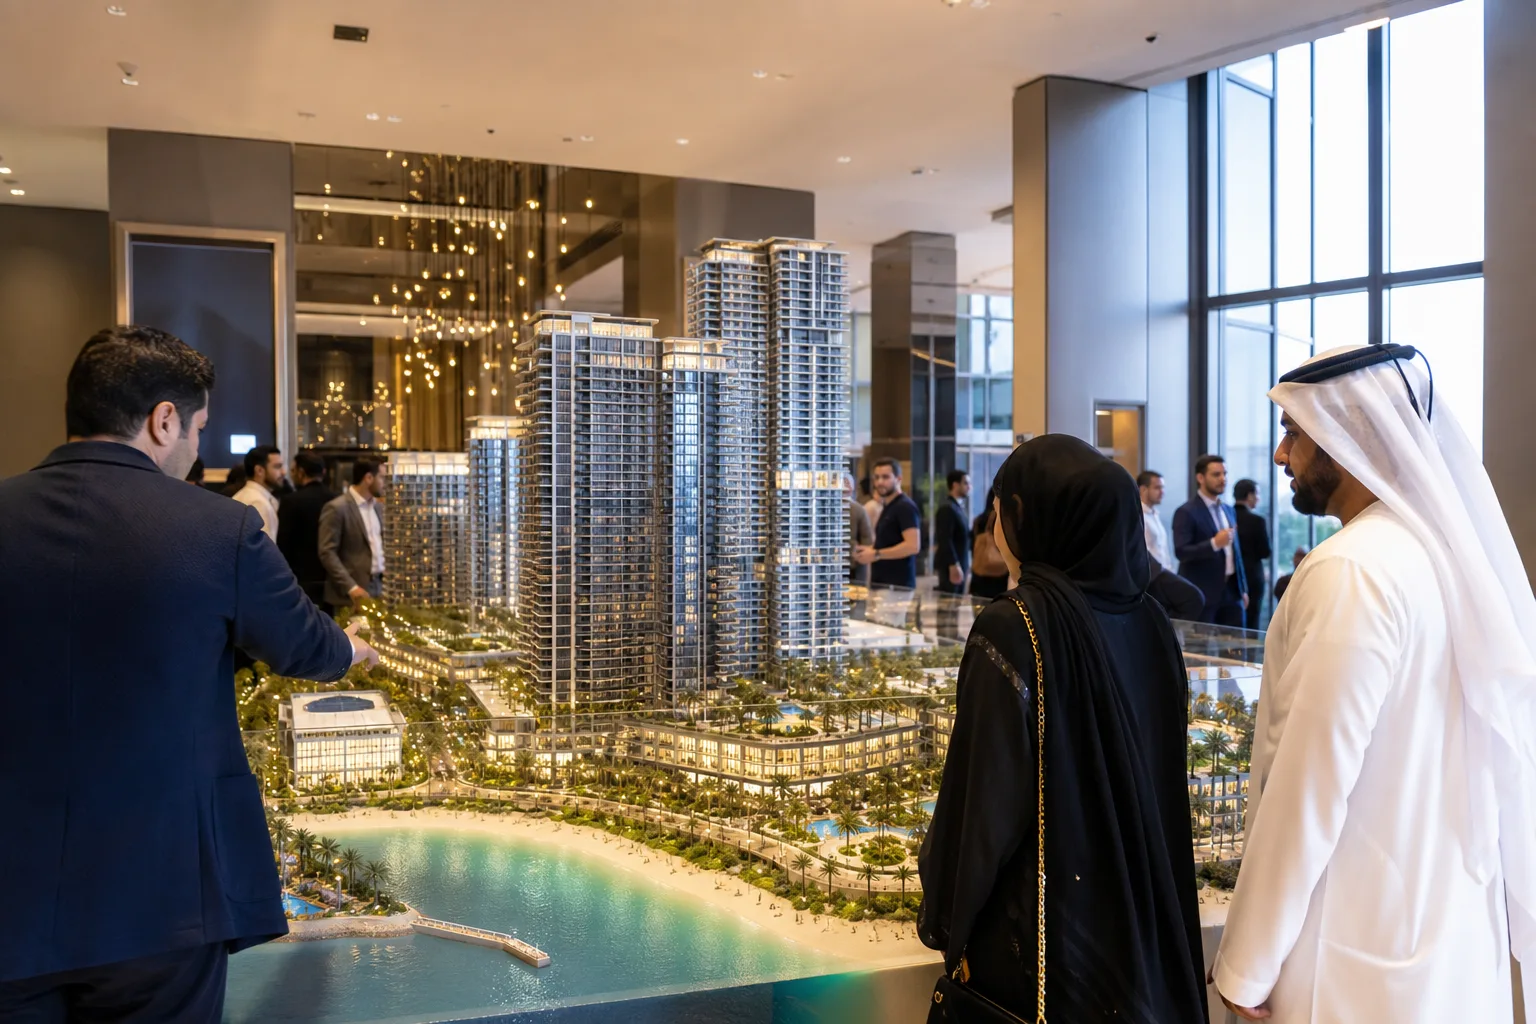
New supply feeds the trend: handovers are staggered from 2019 to 2031. Among the projects we reference, there are 361 programmes carried by 91 developers, with entry tickets from 500,000 AED to 2M AED (median 1.2M AED).
This new stock arrives within a protective framework: escrow accounts are mandatory for off-plan (Law No. 8 of 2007) and the deposit sits between 5% and 20% of the price. A few concrete examples of this wave: The Archive at Dubailand Residence Complex (from 700,000 AED), Canal Heights at Business Bay and Mar Casa at Dubai Maritime City.
The detail of the procedures is covered elsewhere: our guide on the freehold legal framework, the one on the Golden Visa through real estate and the one on buying off-plan.
Reading a trend without getting it wrong: the interpretation traps
The first trap is confusing the average with local reality. The +2.6% median over 12 months hides gaps of more than ten points between a district in full catch-up and a mature area at a standstill: never mix a press-level order of magnitude with a precise district figure.
Featured
View projects: DWTN Residences
From AED 2,271,477
Hand-picked new properties with end-to-end expert support.
View projects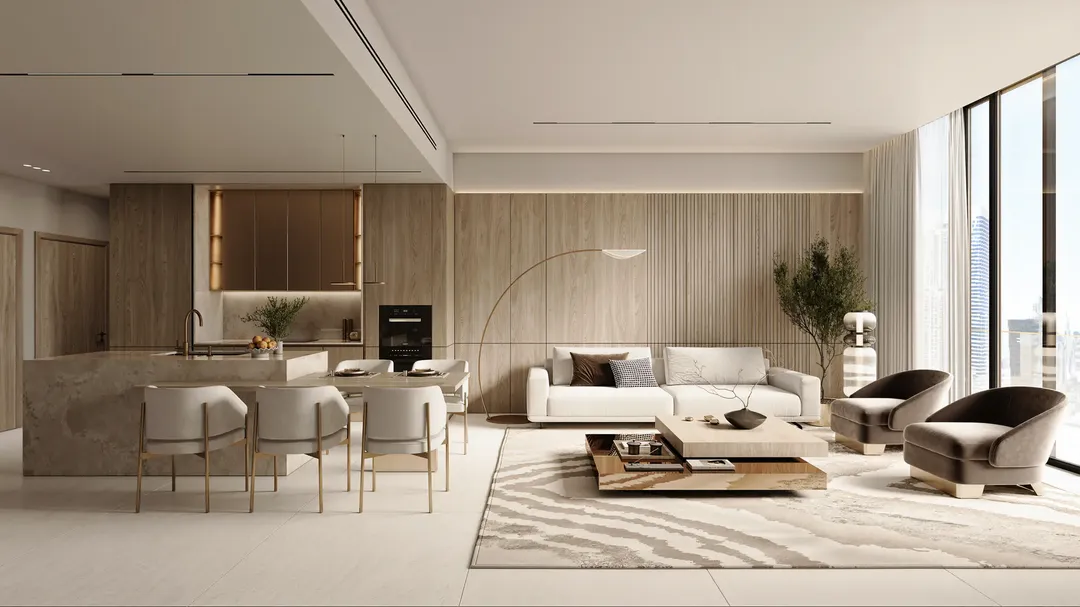
- Gross is not net. The calculated gross yield ignores service charges (3 to 30 AED/sq ft/year according to RERA via Mollak) and rental vacancy. The real yield is lower.
- The past does not replay. Jumeirah Garden City's +147.6% over 60 months is a catch-up already banked, not a mechanical promise of future gains.
- Fees weigh on the net trend. Count 4% transfer fees to the DLD plus around 4,700 to 5,500 AED of fixed costs, and 2% + 5% VAT in agency fees on the secondary market. If you buy with a loan, our guide on mortgages and down payment for non-residents details the cash to plan for on top.
One last blind spot: transmission. By default, Sharia law can apply to inheritance; a registered will (DIFC Wills) secures the fate of the property. This point, like taxation on the home-country side, is developed in our guide on Dubai real estate taxation.
With my clients, the most frequent mistake is still comparing two districts on their recent rise alone. I always bring them back to the real price-to-rent pairing: that is what tells whether a trend stands up.
— Sofiane OULD, Founder & Chief Executive Officer
This article is part of our guide
Dubai Property Investment Guide for Foreign Buyers
About the author

Sofiane OULD
Founder & Chief Executive Officer
A visionary entrepreneur and recognized expert in Dubai's prestige real estate market, Sofiane began his career in Paris before joining major players in online real estate (SeLoger, MeilleursAgents, Airbnb). Based in Dubai since 2019, he quickly established himself as one of the city's top-performing brokers. Founder of Lucretia Immobilier, he now supports his clients with an approach combining integrity, innovation and excellence, thereby redefining the standards of luxury.