Record volumes, prices rising at a calmer pace and sharply different neighbourhoods: our data-driven reading of Abu Dhabi property market trends, district by district.
On this page
- Abu Dhabi property market trends in prices and rents: what the numbers say
- Is the market speeding up or slowing down, district by district?
- Worked example: what the trend means for 1,000 sq ft in Al Rahah or Al Jurf Gardens
- New supply: how many projects, which developers, what handovers?
- Why demand is holding up: the framework behind the market
- Outlook and pitfalls: what the trends don't tell you
Abu Dhabi property market trends are pulling in two directions: transaction values hit a record in the first half of 2026, according to the ADREC (Abu Dhabi Real Estate Centre), while prices are rising far more calmly. The gap between neighbourhoods, meanwhile, remains considerable.
We track these series district by district to spot the areas that are accelerating before they become expensive, and those entering maturity. Here you will find the figures, a worked example and the reading limits worth knowing; our Abu Dhabi market page gives the full picture of our opportunities.
Abu Dhabi property market trends in prices and rents: what the numbers say
Prices are up +6.1% over 12 months in median terms across 10 districts, according to Bayut data (monthly series, latest data point August 2026): a clear rise, without overheating.
The median price stands at AED 1,792/sq ft across the 10 districts with a sales series, according to the same Bayut data. That is the benchmark to keep in mind before calling a price "expensive" or "affordable".
On the rental side, the median calculated gross yield reaches 5.7% across 8 districts publishing both sales and rental data. It ranges from 2.4% in Al Jurf Gardens to 6.8% on Al Maryah Island. This is annual rent ÷ price per sq ft, gross, before service charges and vacancy.
Price gaps are the market's real signature: from AED 858/sq ft in Al Bahyah (April 2026) to AED 3,844/sq ft on Fahid Island (March 2026), according to Bayut data. Two markets coexist: one driven by income, the other by address.
Is the market speeding up or slowing down, district by district?
The market is slowing where it has risen most and accelerating where it had lagged: Fahid Island adds just +1.8% over 12 months after +186.4% over 36 months, according to Bayut data (March 2026).
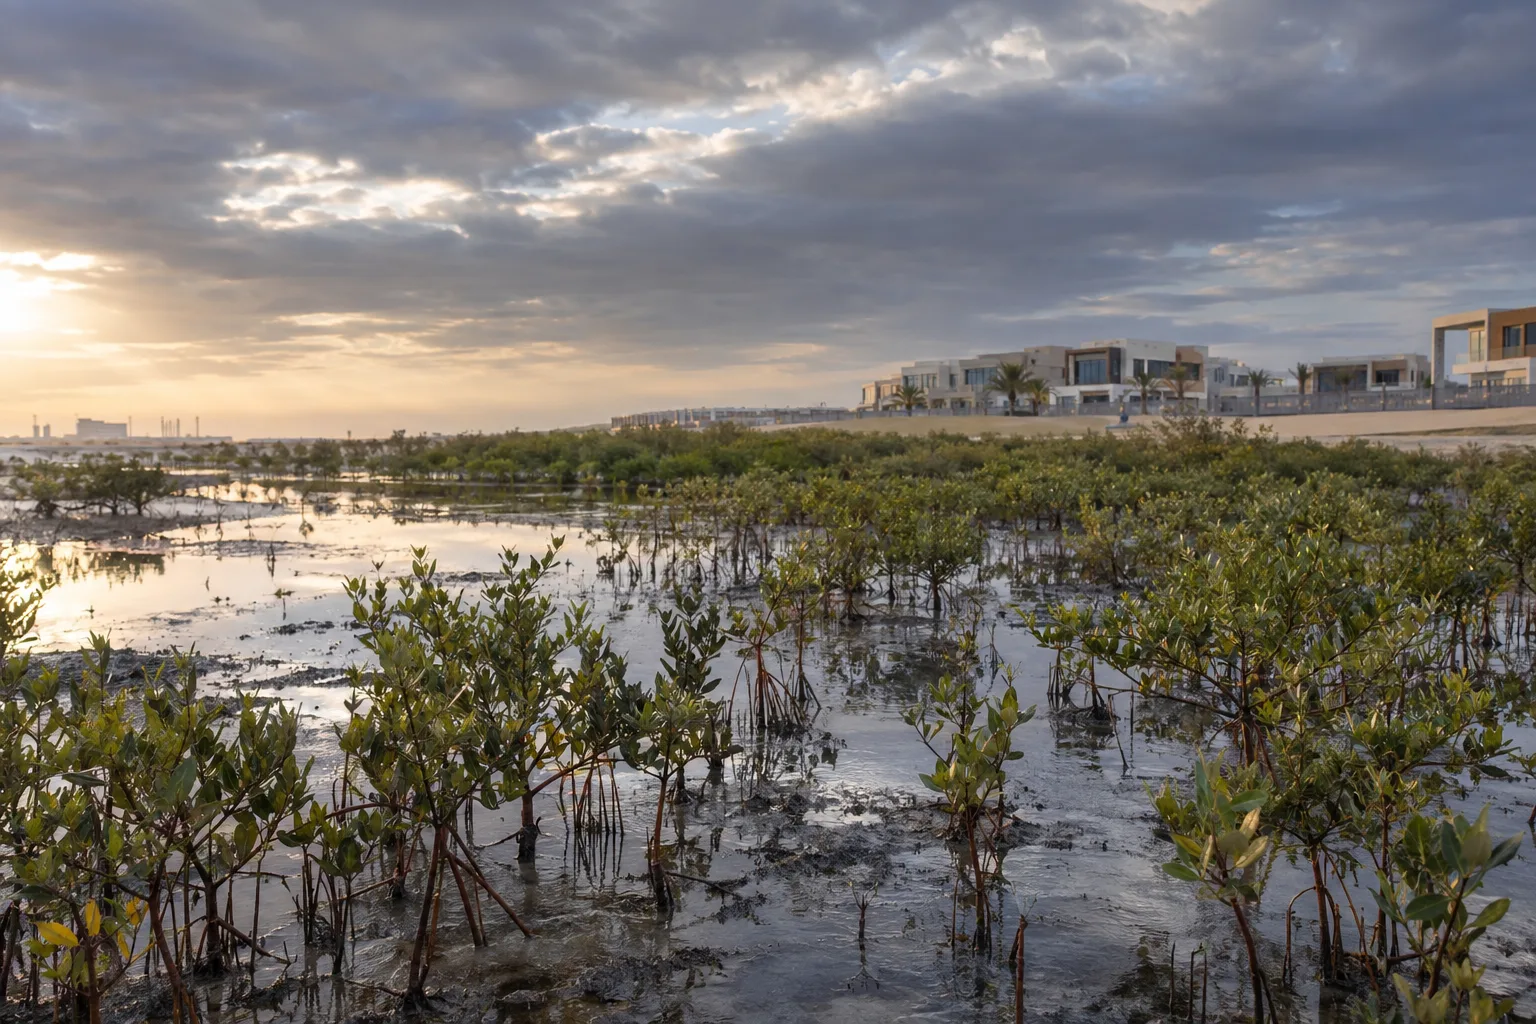
Addresses entering maturity
Saadiyat shows +39.8% over 36 months but +4.1% over 12 months, and Al Maryah Island +3.7% over 12 months (Bayut data, March 2026). Growth continues, at a pace below the median.
Districts catching up
Al Bahyah jumps +44.4% over 12 months after −8.6% over 36 months (Bayut, April 2026). Al Hudayriat Island gains +15.6% over 12 months against +3.5% over 36 months (Bayut, August 2026).
Established districts with steady growth
Yas Island (+6.3%, March 2026), Al Rahah (+6.2%, February 2026) and Reem Island (+6.1%, March 2026) are moving in line with the median, according to Bayut data.
The method comes down to one comparison: set the 12-month pace against the cumulative 36-month rise. I often see clients rely on the three-year figure alone, when it is recent momentum that tells you whether the train is still moving. To find out which of these districts offer freehold ownership to foreign buyers, see our guide Where to invest in Abu Dhabi, dedicated to the areas open to foreigners.
Worked example: what the trend means for 1,000 sq ft in Al Rahah or Al Jurf Gardens
For 1,000 sq ft, Al Rahah generates gross rent of AED 97,000 a year against AED 39,000 in Al Jurf Gardens, for similar purchase prices of AED 1,691,000 and AED 1,603,000 (Bayut data from February and March 2026).
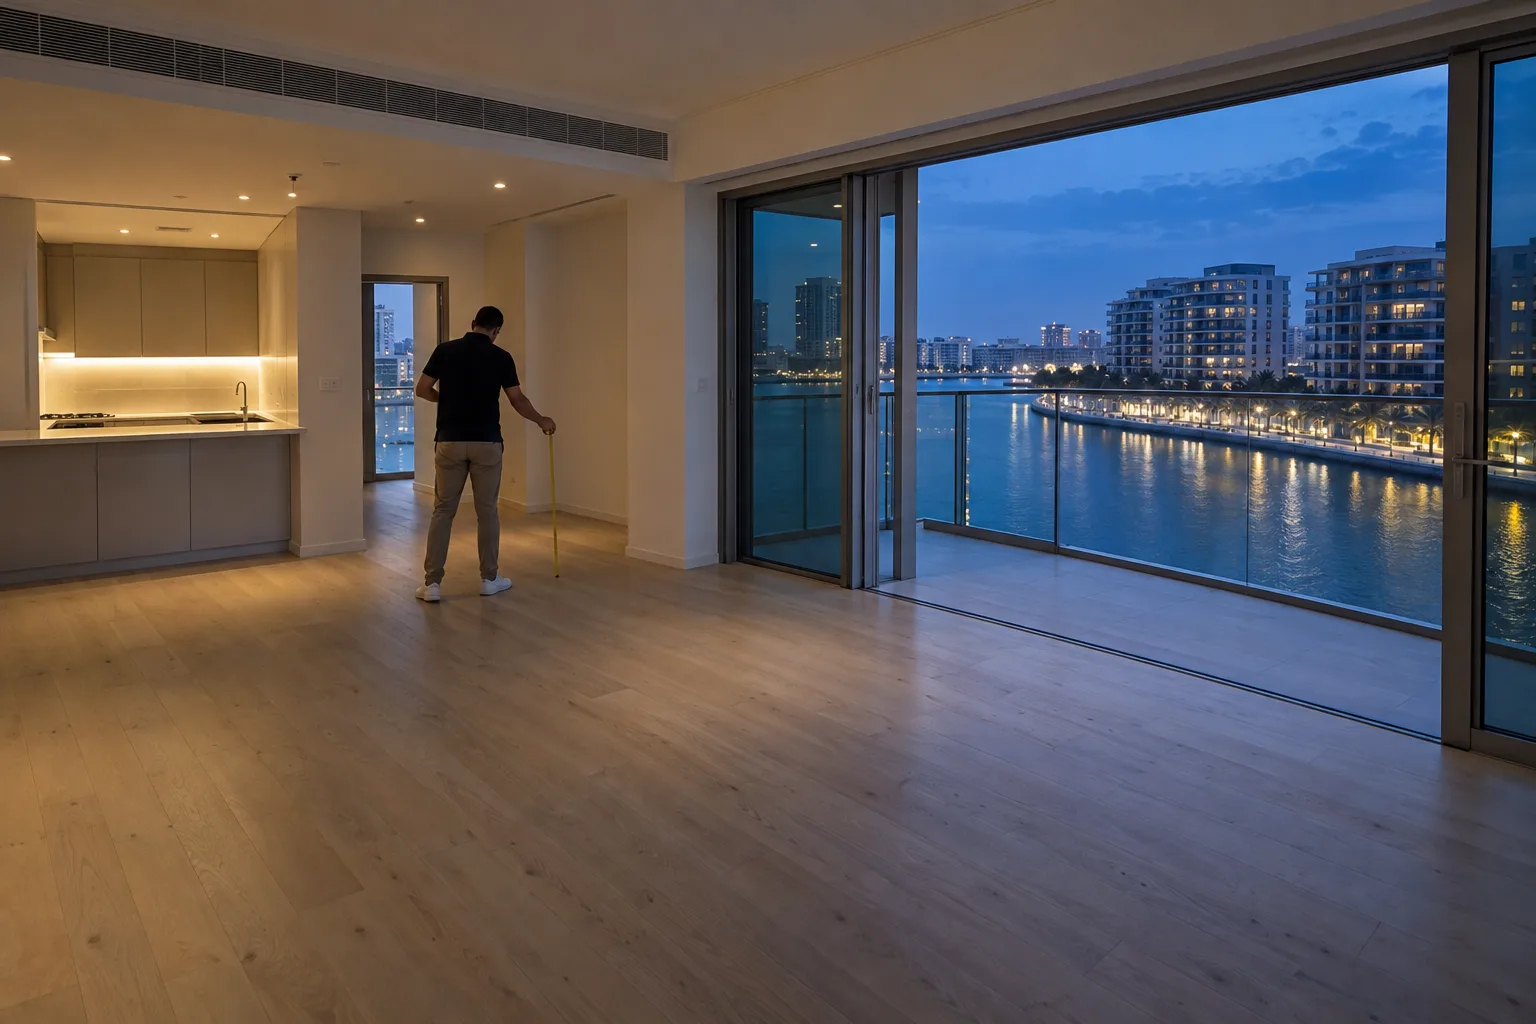
Add the 2% transfer fee, collected via DARI, to arrive at the acquisition cost. The transaction steps are set out in our guide to the buying process in Abu Dhabi.
| Indicator | Al Rahah | Al Jurf Gardens |
|---|---|---|
| Price per sq ft (Bayut) | AED 1,691 (February 2026) | AED 1,603 (March 2026) |
| Price for 1,000 sq ft | AED 1,691,000 | AED 1,603,000 |
| 2% transfer fee (DARI) | AED 33,820 | AED 32,060 |
| Acquisition cost | AED 1,724,820 | AED 1,635,060 |
| Annual rent (AED 97 and 39/sq ft) | AED 97,000 | AED 39,000 |
| Calculated gross yield | 5.7% | 2.4% |
| 36-month change | +34.2% | +59.6% |
| 60-month change | +40% | +74.8% |
The lesson is clear. Al Jurf Gardens has risen further, but its rent per sq ft remains low: what you are mainly buying is a bet that the trend continues. Al Rahah, more measured, pays you while you wait, a key criterion for anyone looking to build passive income in Abu Dhabi.
Why a sharply rising price compresses yield is explained in our guide to rental yields in Abu Dhabi.
New supply: how many projects, which developers, what handovers?
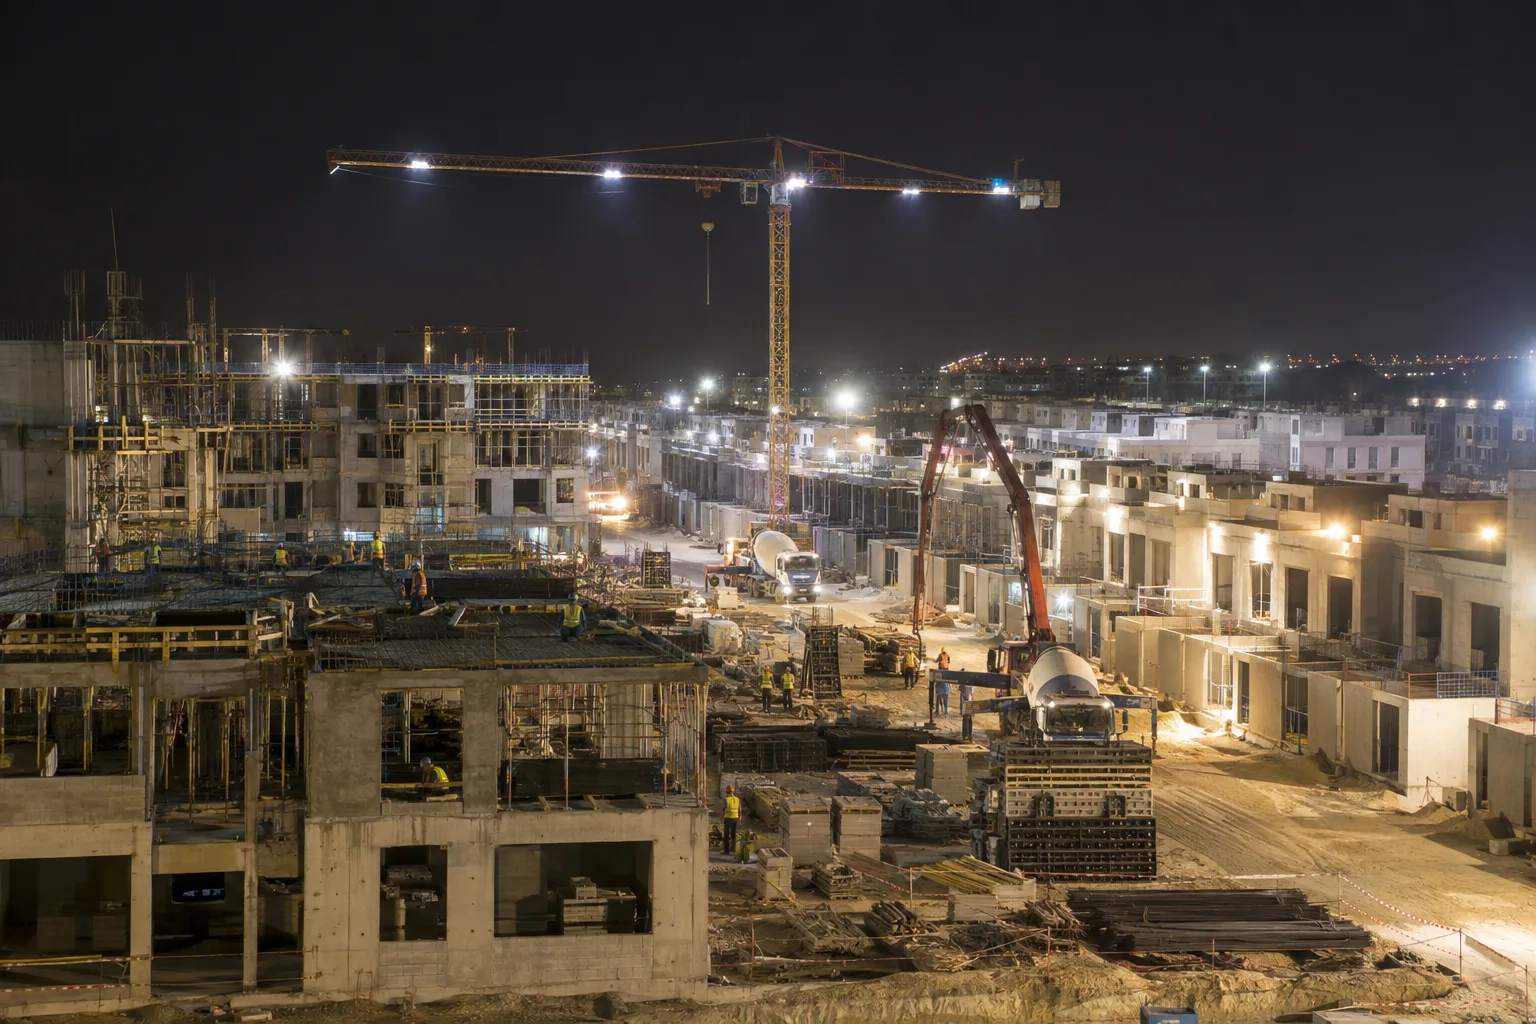
Among the projects we list, new supply comprises 69 published projects from 24 active developers, with handovers spread from 2013 to 2031.
A project in mind?
Talk to a Lucretia adviser
Tailored guidance, no obligation.
Entry prices range from AED 500,000 to AED 2M, with a median of AED 1.5M across the 17 projects with a displayable price. The bottom of the range is Oceanscape on Reem Island, completed in May 2013, from AED 500,000; among new launches, Al-Reeman Gate in Al Shamkhah starts at AED 900,000 for handover in March 2028.
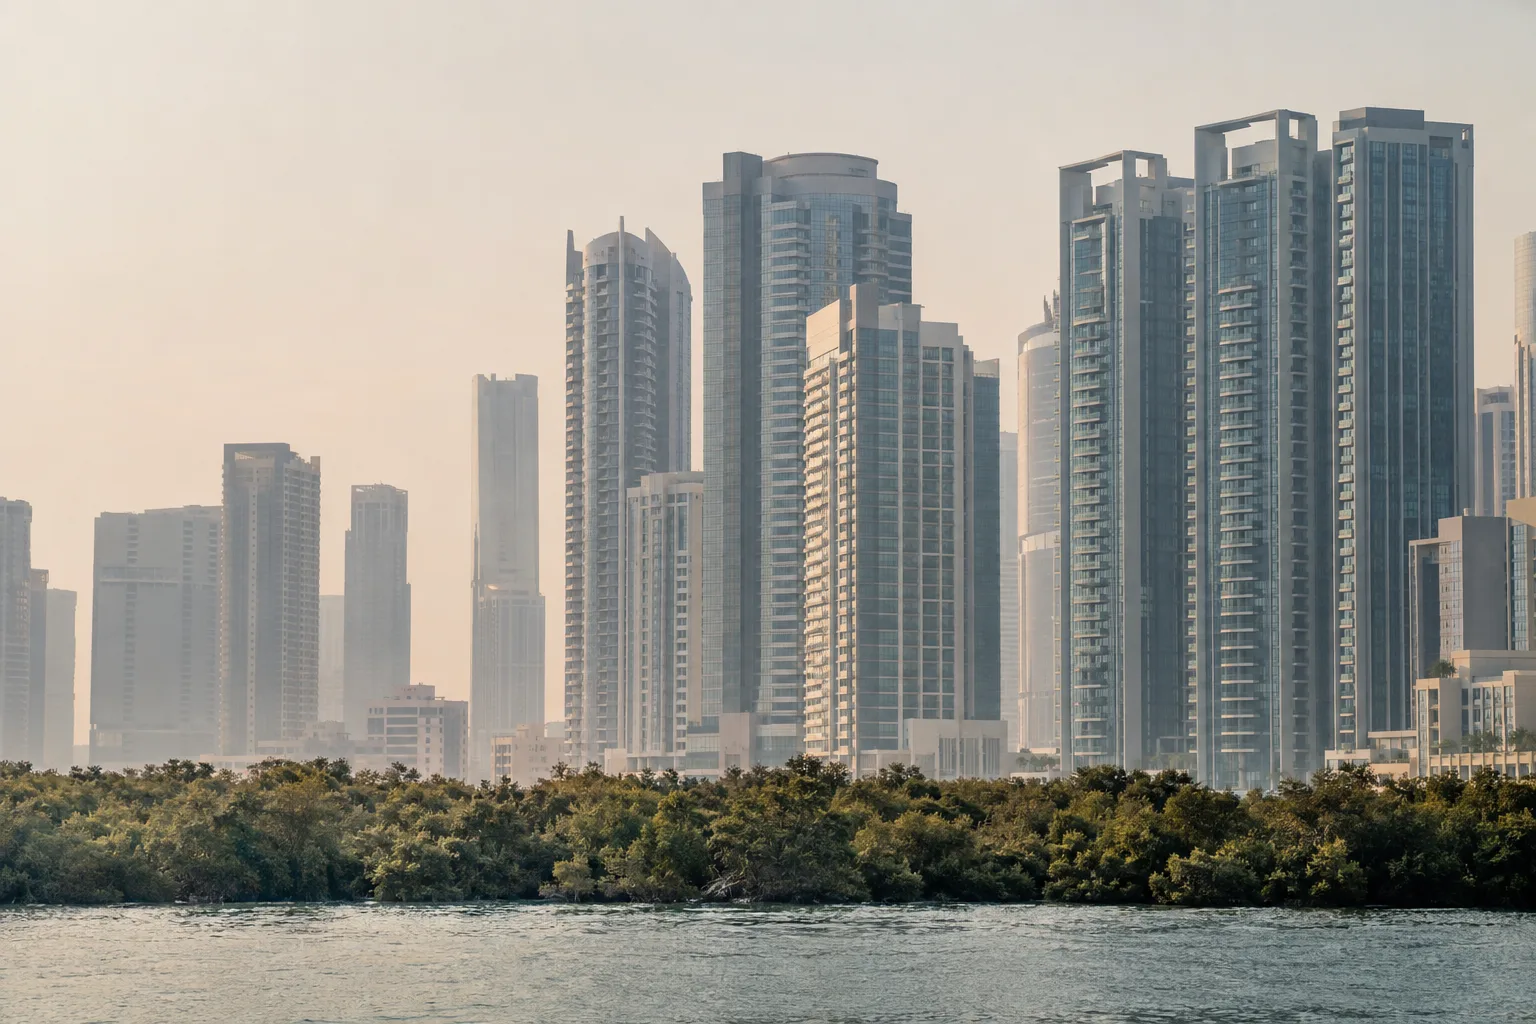
Supply is concentrated on Reem Island, Saadiyat and Al Rahah. Two developers dominate our selection: Aldar Properties and Reportage Properties.
A wave of handovers to plan for
The schedule tightens between 2028 and 2031: Sunstone in December 2028, The Artery Residences in December 2029 (from AED 1.8M), Sei Saadiyat in December 2030, Al Ghadeer Parks in June 2031.
Across the emirate, the stock of around 409,000 homes is set to grow by 71,000 units by 2030, with handovers peaking in 2028, according to ADREC's H1 2026 market report. This influx of supply will weigh on rents in buildings completed at the same time.
The rules specific to off-plan purchases are covered in our guide buying off-plan in Abu Dhabi, and the full range can be browsed in our project catalogue.
Why demand is holding up: the framework behind the market
Demand is holding because the framework draws international capital: foreign direct investment reached AED 13.8bn in the first half of 2026 (+309% year on year), driven by buyers of 116 nationalities, according to ADREC.
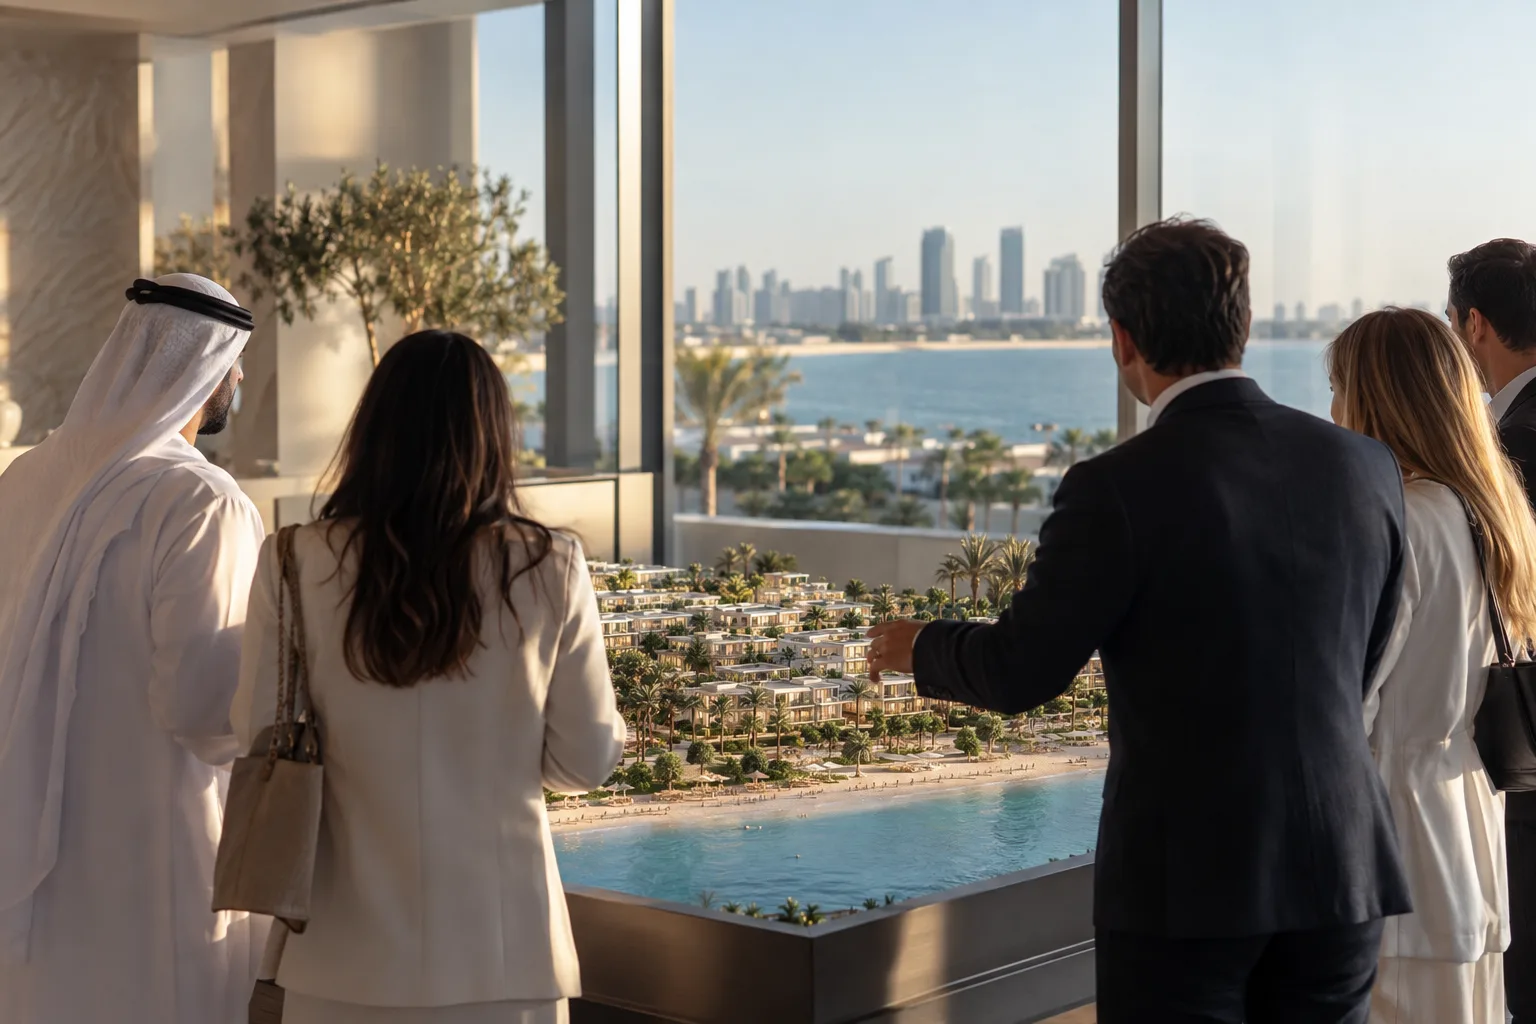
The first driver is access: foreigners buy freehold in designated investment zones, including Reem Island, Yas Island and Saadiyat, according to DARI. These zones attracted AED 75bn in the first half of 2026 (+181%), and 8 new zones were approved, bringing the total to 50, according to ADREC.
The second driver is tax. Individuals pay no income tax, whether on rent or on capital gains, according to the official UAE government portal.
The third driver is residency. The 10-year Golden Visa is available from AED 2,000,000 invested in property, according to the official UAE Golden Visa portal, a threshold above the AED 1.5M median ticket in our catalogue. The real budget is set out in our guide Golden Visa through property in Abu Dhabi.
Freehold ownership, no tax on rental income and documented gross yields: these strengths stand out most against other markets, starting with its neighbour, as our guide to choosing between Abu Dhabi and Dubai shows criterion by criterion. If you are weighing it against a leasehold tropical villa, our comparison Abu Dhabi or Bali for investment sets the two destinations side by side, profile by profile.
Outlook and pitfalls: what the trends don't tell you
A trend only reads well alongside its limits: the Bayut series cited here end in different months, from February to August 2026, so they should never be compared as if they dated from the same day.
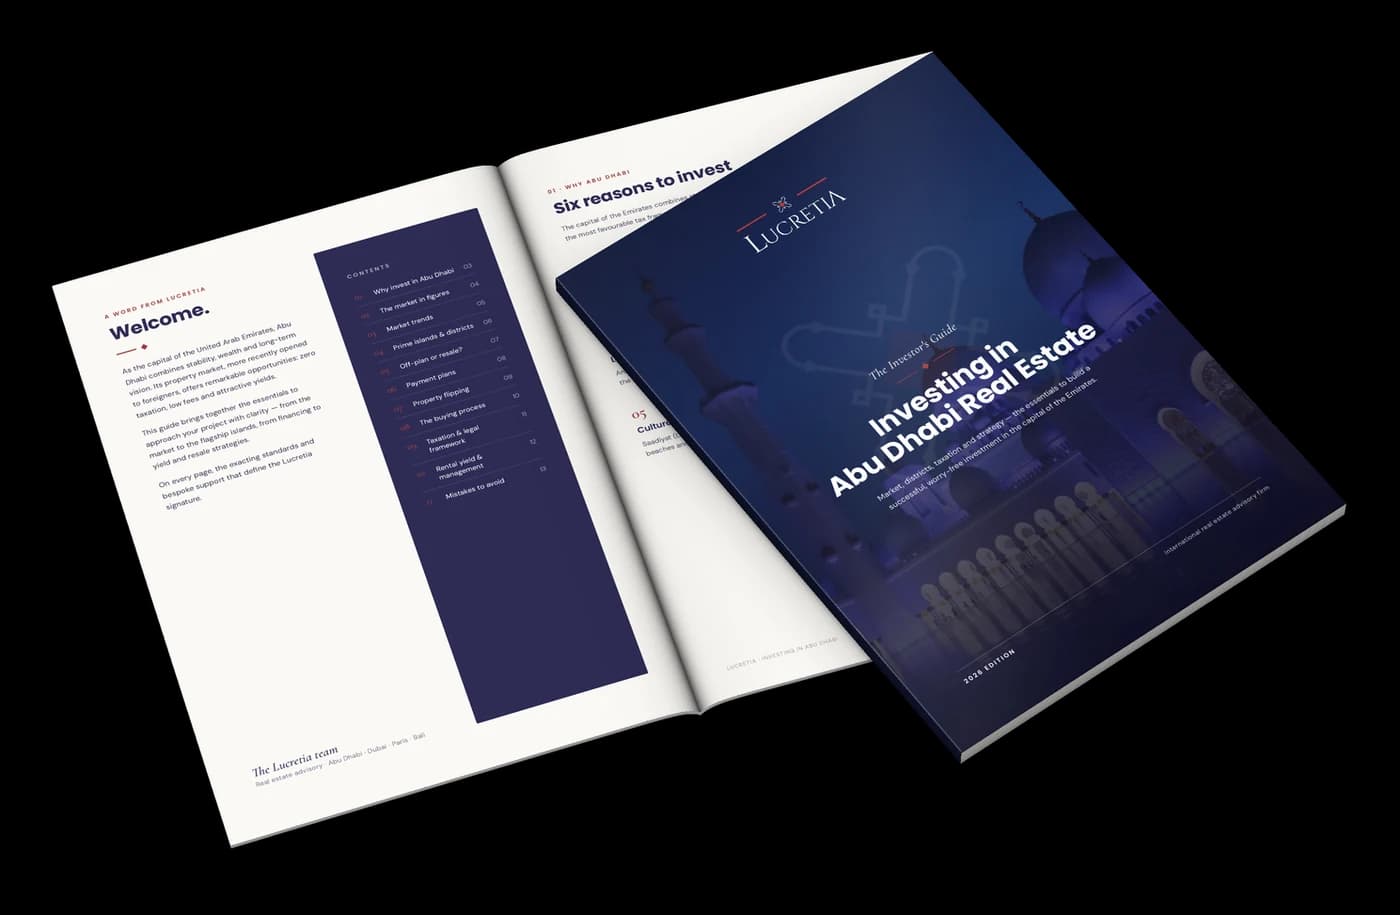
Free guide, delivered on WhatsApp
Get our investment guide
Taxation, visas, financing, buying steps: 14 pages sent to your WhatsApp within minutes.
- A gross yield, not net income. It divides rent by the price per sq ft, before service charges and vacancy; it is neither net nor guaranteed. Fahid Island and Al Hudayriat Island publish no rental data, so no yield can be calculated there.
- Volatile series. Al Bahyah shows +116.2% over 60 months but −8.6% over 36 months; Al Hudayriat Island has no 60-month history. Extrapolating past growth there would be a mistake.
- A catalogue is not the market. The 69 projects we list do not represent all transactions, and properties above AED 2M are shown as "price on request".
On the ground, the best decisions I help clients make rarely come from the most talked-about district. They come from buyers who compare rent per sq ft with the purchase price, building by building, before looking at the curve.
This article is part of our guide
Abu Dhabi Property Investment Guide: Buy, Let and Resell with Confidence
About the author

Sofiane OULD
Founder & Chief Executive Officer
A visionary entrepreneur and recognized expert in Dubai's prestige real estate market, Sofiane began his career in Paris before joining major players in online real estate (SeLoger, MeilleursAgents, Airbnb). Based in Dubai since 2019, he quickly established himself as one of the city's top-performing brokers. Founder of Lucretia Immobilier, he now supports his clients with an approach combining integrity, innovation and excellence, thereby redefining the standards of luxury.